

Collaboration and Data Sources
Data Generation
The sequencing data was generated using an amplicon-based sequencing scheme, PrimalSeq (Grubaguh et al. Genome Biology 2019). Our full protocol is available online here. Sequencing reads were aligned using bwa and processed using iVar.
Raw Data
Consensus sequences and BAM files along with associated metadata are available on Google Cloud. A summary of the alignment statistics, limited to the first 30 samples, is shown below in Table 1. Statistics for the remaining samples are available on GitHub.
| Table 1. Sample Composition | |
|---|---|
| Samples | 117 |
| Years | |
| 2016 | 23 |
| 2017 | 74 |
| 2020 | 20 |
| Counties | |
| Polk | 48 |
| Pottawattamie | 21 |
| Story | 17 |
| Blackhawk | 14 |
| Woodbury | 10 |
| O’Brien | 2 |
| Monona | 2 |
| Fremont | 1 |
| Van Buren | 1 |
| Dickinson | 1 |
| Table 2. Alignment statistics | |||
|---|---|---|---|
| Metric | Mean | Minimum | Maximum |
| Total Reads | 188,234 | 48,159 | 450,251 |
| CDS Coverage | 95.5% | 70.2% | 100.0% |
| Mean Per Base Coverage | 3,956 | 954 | 9526 |
Preliminary Analysis
We constructed a maximum likelihood (ML) phylogeny using 2152 genomes of West Nile virus from the USA including 117 of the provided samples which had genome coverage greater than 70%, highlighted in light blue. Tree and root to tip regression plot are shown in Figure 1.
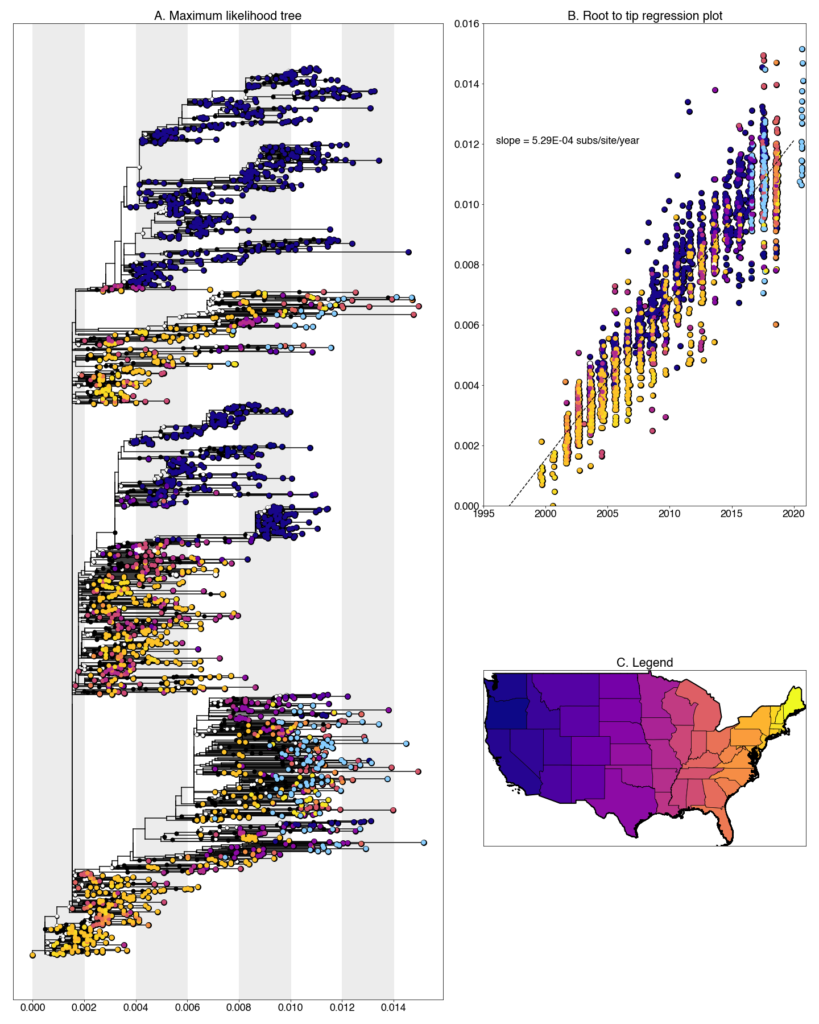
Figure 1: A. Maximum likelihood tree constructed using RAxML (bootstrap repeated 100 times) with 2152 genomes of West Nile virus from the USA including 117 genomes provided by Iowa State University (Highlighted in light blue). B. Root to tip regression plot. C. Legend
Iowa sequences form numerous transmission chain across the tree, characteristic of other Eastern states. The virus has very few geographic barriers and reintroductions are common. Despite the presence of multiple chains, singleton introductions are uncommon. Most sequences form small clades with other sequences from the same county and year.
Despite this, there are a number of instances of overwintering in Iowa, where lineages persist in the state from one year to the next. Within the tree, there is evidence of lineages persisting over the length of our sampling period, 2016-2020. Beyond this range, it is unclear how long they persist. No newly generated sequences clade with other publicly available Iowa sequences (sampled between 2002-2008), indicating that while overwintering is occurring, there is also substantial replacement over longer timescales.
Iowa transmission chains are found throughout the tree and lie closely with a variety of states. A majority fall within clades of sequences collected from other Midwest states, such as Colorado, Illinois, and Ohio, and others lie with more distant states like Louisiana, New Hampshire and New York. Clearly, some regional circulation within the larger Eastern United States is occurring at a higher frequency than more long-ranged transmission. However, it should also be noted, that due to our sequencing efforts these states have the greatest representation in the tree in the Eastern United States so some amount of sampling bias is also certainly at play. We are continuing to correct this with both phylogenetic analyses and further sampling.
The newly generate Iowa sequences are some of the most recent sequences in the tree. Interestingly, most fall into an Eastern United States dominated clade within WN02 as opposed to SW03. While we lack sequences from other location, this might indicate that WN02 viruses are out-competing SW03 viruses in the Eastern United States. Additional sampling in other states over this same time frame will enable us to more thoroughly describe this phenomenon.
Contamination Monitoring
This is the first batch of samples which we have processed with our new protocol for contamination monitoring. The approach involves spiking-in sample-specific barcoded transcripts at the beginning of library preparation to estimate the amount of spillover between samples. Table 1. contains a new Percent Contamination column which is the percentage of barcode reads that align to barcodes from other samples. In general, contamination is suitable low for all samples so as to not have interfered with downstream consensus calling and phylogenetic analysis. There are a few samples with higher contamination levels but we’re confident that these are a result of increased variability in the metric when the number of total barcode reads is low.
Disclaimer
Please note that this data is released as work in progress by the WestNile 4K Project and should be considered preliminary. If you intend to include any of these data in publications, please let us know – otherwise please feel free to download and use without restrictions. We have shared this data with the hope that people will download and use it, as well as scrutinize it so we can improve our methods and analyses. Please contact us if you have any questions or comments.