

Collaboration and data sources
We received 212 samples of RNA extracted from mosquito pools that tested positive for West Nile virus from Alex Westrich, Claudia Blanco, and Raed Mansour from the City of Chicago Department of Public Health. Samples were selected for sequencing from each trap location within the city that we had samples from. 26 samples were ultimately selected and had suitable genome coverage after sequencing for phylogenetic analysis. All samples came from a single year, 2018. In this update, we highlight the sequencing results and a few conclusions drawn from a maximum likelihood based phylogenetic analysis.
Data Generation
The sequencing data was generated using an amplicon-based sequencing scheme, PrimalSeq (Grubaguh et al. Genome Biology 2019). Our full protocol is available online here. Sequencing reads were aligned using bwa and processed using iVar.
Raw data
Consensus sequences and BAM files along with associated metadata are available on Google Cloud. Alignment statistics are shown in Table 1 below.
| Table 1. Alignment statistics | ||
|---|---|---|
| Sample | Percent Genome Coverage | Mean Coverage per Nucleotide |
| W1517 | 97.4% | 3541.0 |
| W1522 | 95.0% | 2483.1 |
| W1525 | 97.9% | 3222.9 |
| W1529 | 98.1% | 3407.8 |
| W1530 | 97.8% | 3400.9 |
| W1531 | 97.7% | 3192.7 |
| W1537 | 97.9% | 3167.0 |
| W1538 | 98.2% | 2700.2 |
| W1540 | 97.7% | 2978.3 |
| W1564 | 98.3% | 3230.0 |
| W1568 | 97.7% | 3486.5 |
| W1580 | 98.7% | 2862.7 |
| W1586 | 98.7% | 2735.4 |
| W1614 | 97.4% | 3367.2 |
| W1630 | 98.0% | 3028.2 |
| W1633 | 96.2% | 4056.7 |
| W1638 | 97.5% | 3111.3 |
| W1647 | 98.9% | 3243.9 |
| W1648 | 98.7% | 2890.1 |
| W1656 | 97.4% | 3387.1 |
| W1668 | 97.4% | 3798.4 |
| W1670 | 96.5% | 3694.6 |
| W1685 | 97.7% | 4226.3 |
| W1688 | 69.4% | 3013.5 |
| W1702 | 96.4% | 4232.0 |
| W1705 | 97.4% | 3657.8 |
Preliminary Analysis
We constructed a maximum likelihood (ML) phylogeny using 1927 genomes of West Nile virus from USA including 26 of the provided samples which had genome coverage greater than 70%, highlighted in light blue. Tree and root to tip regression plot are shown in Figure 1.
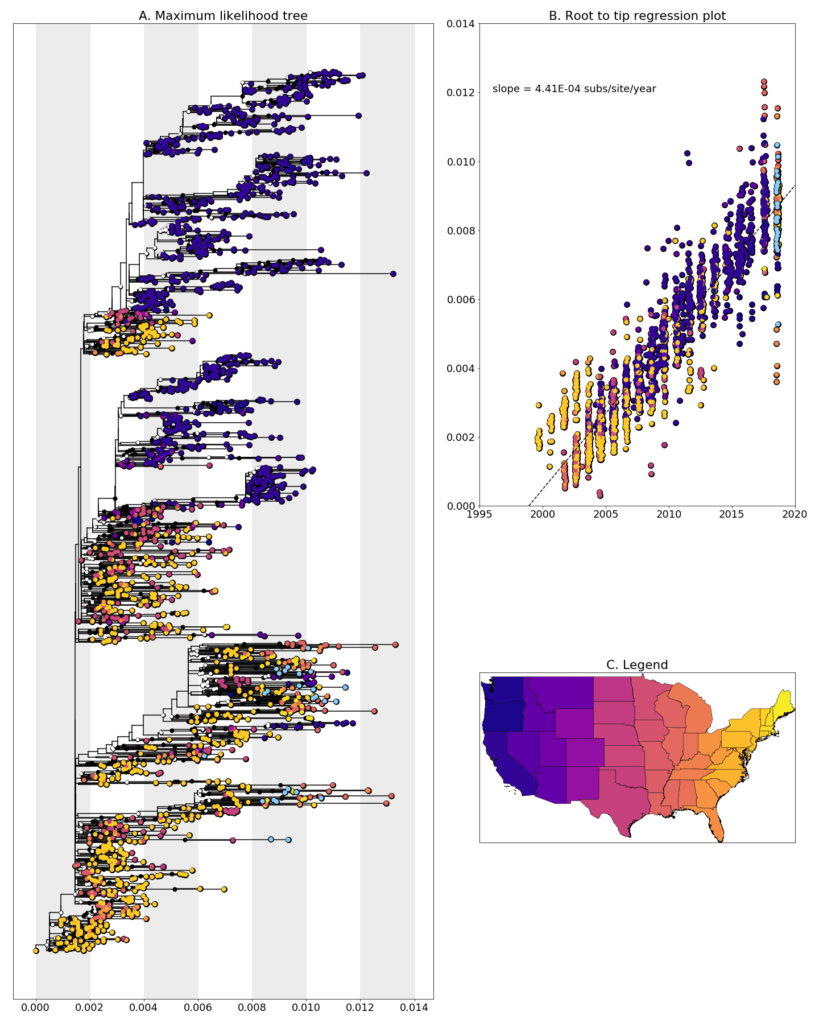
Figure 1: A. Maximum Likelihood tree constructed using RAxML (Bootstrap repeated 100 times) with 1927 genomes of West Nile virus from USA including 26 genomes provided by the City of Chicago Department of Public Health (highlighted in light blue). B. Root to tip regression plot. C. Legend
Illinois sequences are found spread throughout the tree in clades containing mostly Eastern United States sequences. In general, these sequences don’t cluster together within the tree, and form multiple separate clades with sequences from a range of states, including Louisiana, New Hampshire, New York, and Ohio. This is likely occurring for one of two reasons. First, this could be evidence of extensive mixing of transmission chains in the Eastern United States as compared to what we’ve seen in the West (see California and Washington). Due to environmental and/or host conditions, the virus is not able to overwinter in Illinois and is readily replaced each year by another introduced virus. Long branch lengths between neighboring sequences in these areas of the tree and only having sequencing information from a single year mean that it is hard to pin down exactly where and how often these introductions occur. Sampling from neighboring states and previous years is necessary to confirm this. On the other hand, given that this is preliminary data, an alternative explanation is that these sequences contain contamination given that most of the sequences the Illinois genomes cluster with were processed and sequenced in our lab. We are exploring both possibilities and will report on our finding when we have something conclusive.
Disclaimer
Please note that this data is released as work in progress by the WestNile 4K Project and should be considered preliminary. If you intend to include any of these data in publications, please let us know – otherwise please feel free to download and use without restrictions. We have shared this data with the hope that people will download and use it, as well as scrutinize it so we can improve our methods and analyses. Please contact us if you have any questions or comments.