

Collaboration and Data Sources
The samples from San Diego county were provided by Nikos Garfield and Saran Grewal from the San Diego County Vector Control Program. The samples from all the other counties in California, including Sacramento-Yolo and Kern were provided by Ying Fang and Chris Barker from the Barker Lab, University of California, Davis and Sarah Wheeler from Sacramento-Yolo Mosquito and Vector Control Program.
The samples from WA were provided by Krisztian Magori from the Eastern Washington University, Amy Salamone, Wayne Clifford and David Kangiser from the Washington State Department of Health.
Data Generation
The sequencing data was generated using PrimalSeq (Grubaugh et al. Genome Biology 2019). Our full protocol is available online here. Sequence reads were aligned using bwa and processed using iVar.
Raw Data
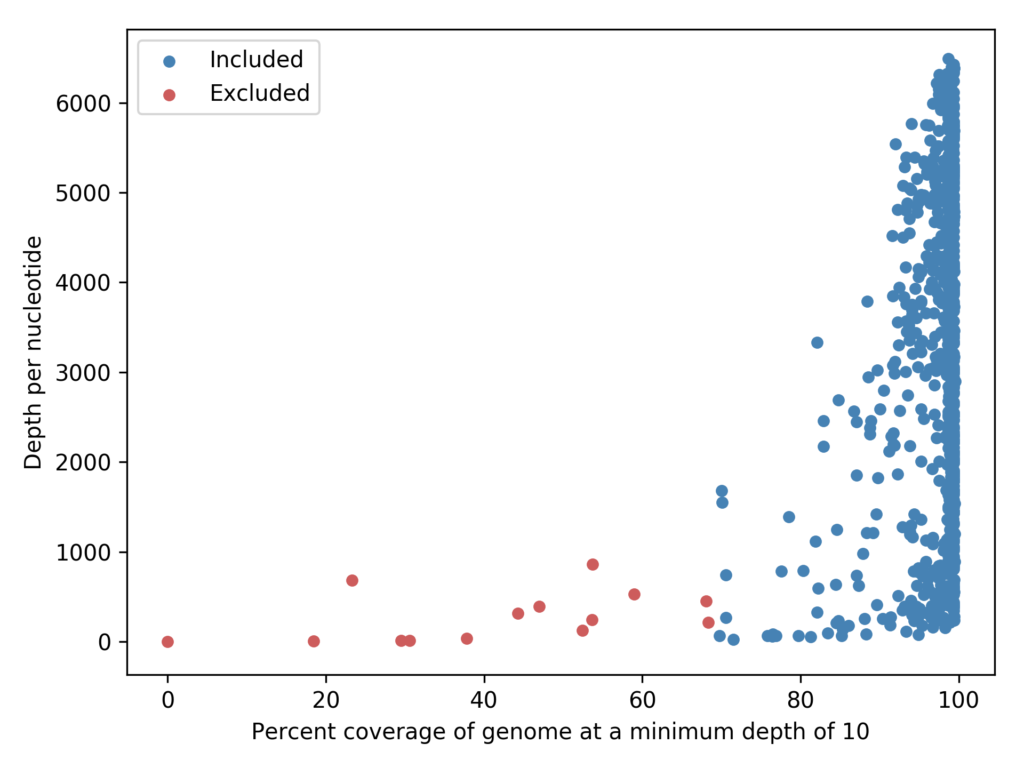
Fig 1. Genomes with <50% coverage were excluded from downstream analysis and are highlighted in red.
The consensus sequences and associated metadata are available on Github. The alignment files in BAM format are available on Google cloud: California and Washington.
Percent coverage and depth per nucleotide for all alignments are available in a tsv file on Github.
Preliminary Analysis
A total of 615 samples from California were used in this analysis of which 7 from Washington. The sampling scheme in California, shown in Fig 3B, was put together specifically to explore the longitudinal transmission dynamics of West Nile virus(WNV).
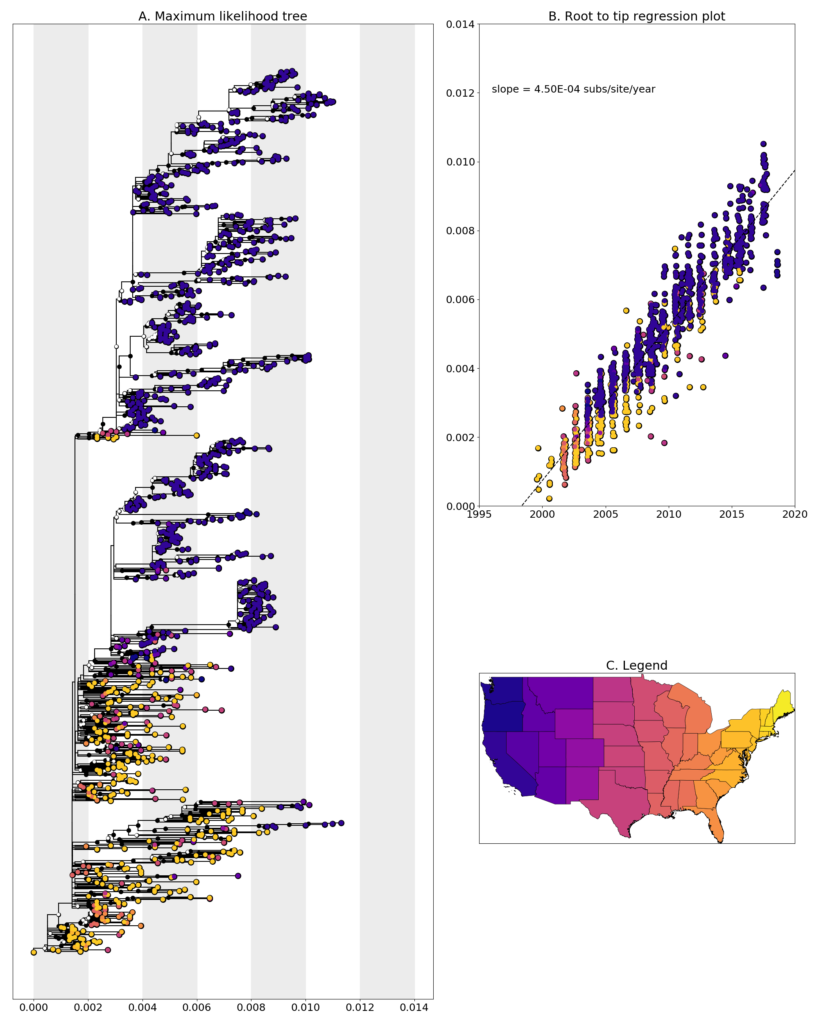
Fig 2. (A) Maximum Likelihood tree constructed with RAxML using the general time-reversible(GTR) nucleotide substitution model and gamma distributed rates amongst sites. Confidence estimates were made using bootstrap repeated 100 times. Filled black circles represent values >= 75. Partially filled black circles represent values <= 75 and >= 50. No circle implies confidence < 50. (B) Root to tip regression plot showing a clock rate of 4.5 x 10⁻⁴ substitutions per site per year. (C) Legend showing the coloring scheme for different states in the continental United States.
We constructed a maximum likelihood (ML) phylogeny using 1167 sequences from USA. Fig 2 illustrates the clear spread of the virus from east to west. From the ML tree in Fig 2, we pulled out all clades with >= 90% of sequences from CA which are shown in Fig 3.
In the uppermost clades in the ML tree (shown above) we see that sequences from San Diego (red), Kern (orange) and Sacramento-Yolo counties (shades of green) cluster together. This clearly indicates a movement of the virus between the North and the South. In addition, we see that the sequences from San Diego cluster directly with sequences from Sacramento indicating that this maybe a transmission chain covering a large distance. This could suggest transmission via migratory birds, but further analysis using time resolved phylogenies is essential to investigate this hypothesis.
In the lower clades of the ML tree (also shown below), we see that the sequences from WA (labelled WA) diverge from a clade predominantly comprised of sequences from Kern. However, due to the long genetic distance between the two clades and the low support value of the basal node, it is difficult to point to evidence of transmission between the two states. We also see that there is transmission of the virus between San Diego and Kern. We also see that a large San Diego clade diverges from sequences from Texas and Arizona. This gives more support to the spread of the virus to CA from the southern states due to geographic constraints like the Rocky mountains curtailing the spread from the east to west.
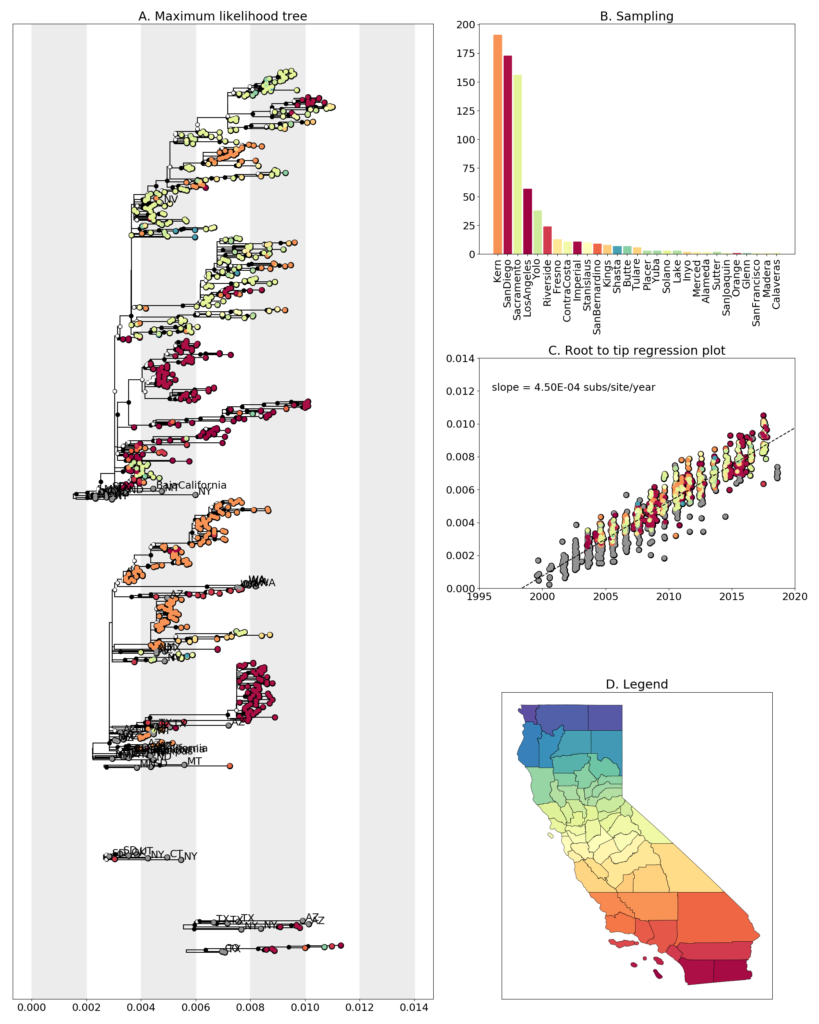
Fig 3. (A) Clades with >=90% of sequences from CA from ML tree in Fig 2. (B) Sampling scheme across counties in California. (C) Root to tip regression plot showing a clock rate of 4.5 x 10⁻⁴ substitutions per site per year. (D) Legend showing the coloring scheme for different counties in California. Samples from WA are labelled WA. Sequences from outside of California are colored in grey.
Disclaimer
Please note that this data is released as work in progress by the WestNile 4K Project and should be considered preliminary. If you intend to include any of these data in publications, please let us know – otherwise please feel free to download and use without restrictions. We have shared this data with the hope that people will download and use it, as well as scrutinize it so we can improve our methods and analyses. Please contact us if you have any questions or comments.