

Collaboration and Data Sources
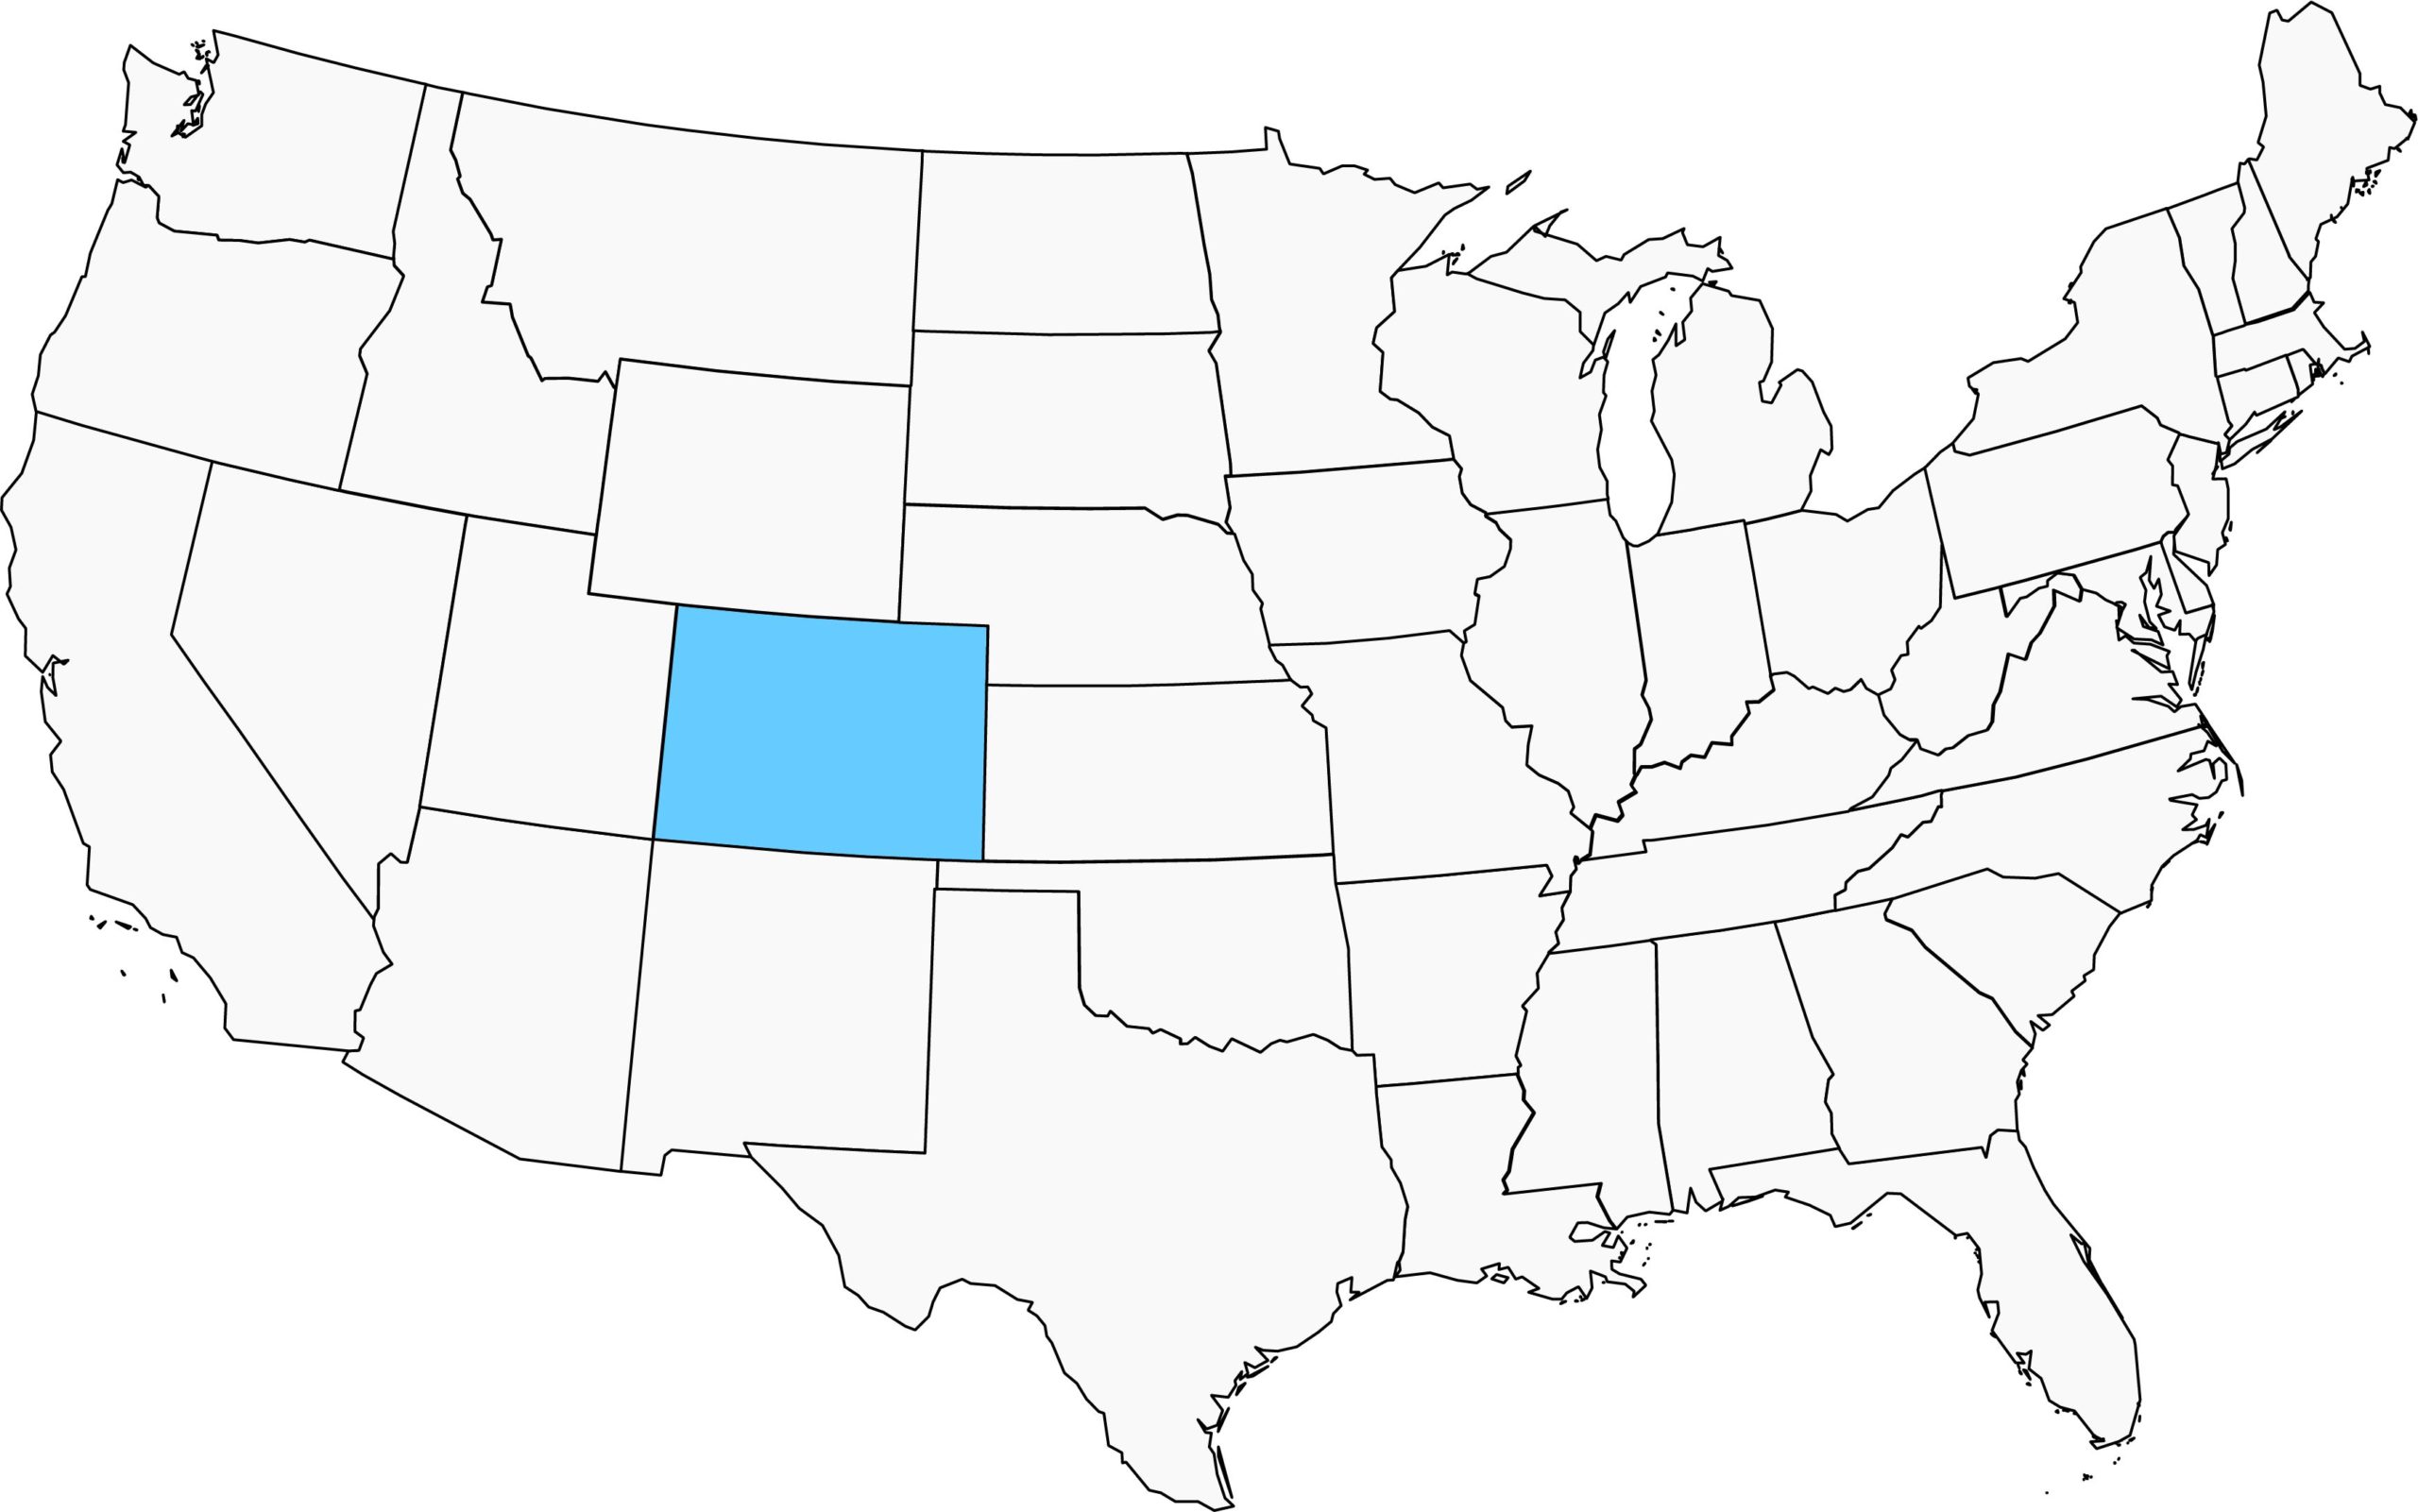
We received 626 samples of RNA extracted from mosquito pools that tested positive for West Nile virus from Greg Ebel, Reyes Murrieta, Joseph Fauver, and Michael C. Young from Colorado State University. 94 samples were selected and had suitable genome coverage after sequencing for phylogenetic analysis. Samples came from Larimer County between the years 2013 and 2018. In this update, we highlight the sequencing results and a few conclusions drawn from a maximum likelihood based phylogenetic analysis.
Data Generation
The sequencing data was generated using an amplicon-based sequencing scheme, PrimalSeq (Grubaguh et al. Genome Biology 2019). Our full protocol is available online here. Sequencing reads were aligned using bwa and processed using iVar.
Raw Data
Consensus sequences and BAM files along with associated metadata are available on Google Cloud. A summary of the alignment statistics, limited to the first 30 samples, is shown below in Table 1. Statistics for the remaining samples are available on GitHub.
| Table 1. Alignment statistics | |||
|---|---|---|---|
| Sample | Percent Genome Coverage | Mean Coverage per Nucleotide | Percent Contamination |
| W1750 | 74.4% | 2030.1 | 0.3% |
| W1751 | 100.0% | 6259.8 | 0.5% |
| W1752 | 100.0% | 6849.6 | 0.7% |
| W1753 | 100.0% | 5754.5 | 0.7% |
| W1754 | 100.0% | 4483.0 | 1.1% |
| W1755 | 100.0% | 6092.2 | 0.4% |
| W1756 | 100.0% | 6846.7 | 0.5% |
| W1757 | 100.0% | 7817.0 | 0.5% |
| W1758 | 97.8% | 3935.1 | 0.3% |
| W1759 | 100.0% | 17680.7 | 0.3% |
| W1760 | 100.0% | 10153.5 | 0.3% |
| W1761 | 100.0% | 7436.1 | 1.9% |
| W1762 | 100.0% | 8658.4 | 23.3% |
| W1763 | 100.0% | 17017.7 | 0.6% |
| W1764 | 97.7% | 7716.4 | 0.3% |
| W1765 | 89.3% | 3219.3 | 0.4% |
| W1766 | 87.8% | 3617.7 | 0.3% |
| W1767 | 100.0% | 6650.4 | 0.6% |
| W1768 | 100.0% | 7818.7 | 1.1% |
| W1769 | 100.0% | 8110.5 | 1.6% |
| W1770 | 100.0% | 7976.4 | 5.1% |
| W1771 | 92.4% | 3370.4 | 0.2% |
| W1772 | 100.0% | 6026.0 | 0.3% |
| W1773 | 100.0% | 11132.5 | 0.5% |
| W1774 | 100.0% | 8720.8 | 0.9% |
| W1775 | 100.0% | 10554.4 | 1.8% |
| W1776 | 100.0% | 8900.0 | 0.7% |
| W1777 | 100.0% | 7412.5 | 1.0% |
| W1778 | 77.2% | 6623.3 | 4.3% |
| W1779 | 78.4% | 3203.6 | 0.2% |
Preliminary Analysis
We constructed a maximum likelihood (ML) phylogeny using 2035 genomes of West Nile virus from the USA including 94 of the provided samples which had genome coverage greater than 70%, highlighted in light blue. Tree and root to tip regression plot are shown in Figure 1.
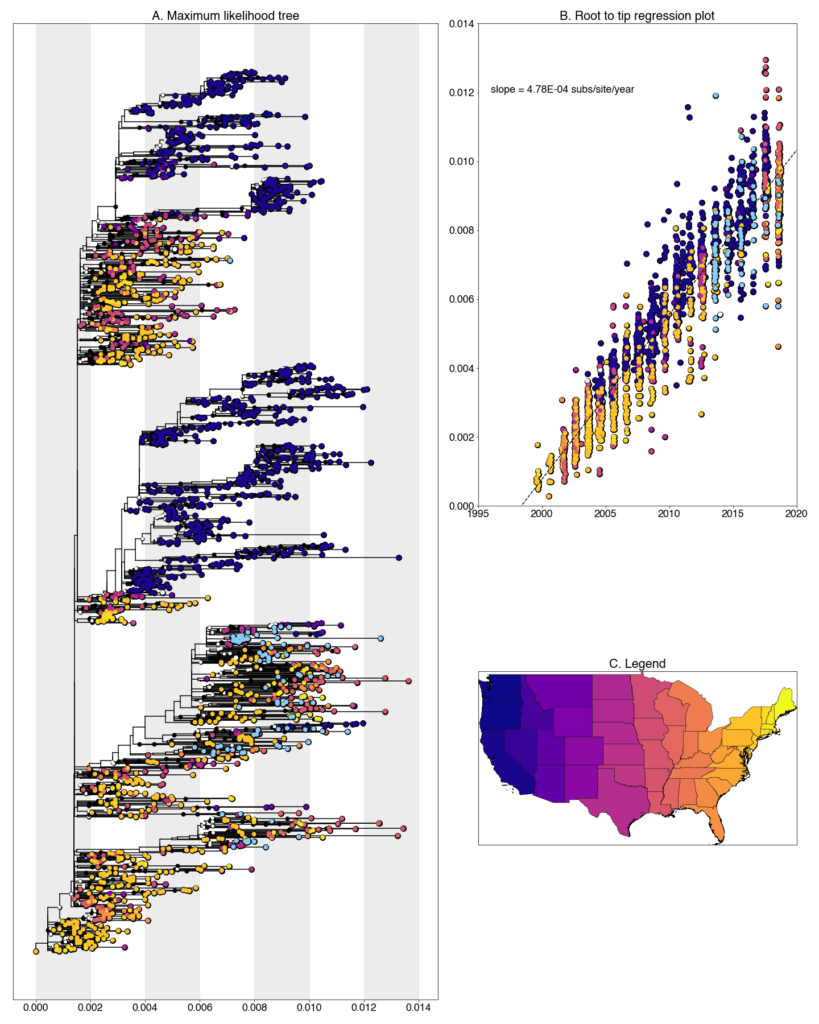
Figure 1: A. Maximum likelihood tree constructed using RAxML (bootstrap repeated 100 times) with 2035 genomes of West Nile virus from USA including 94 genomes provided by Colorado State University (Highlighted in light blue). B. Root to tip regression plot. C. Legend
Colorado sequences are found throughout the tree and lie closely with a variety of states. A majority fall within clades of sequences collected from other southwest states (Arizona, California, and Texas), while others are placed in clades from more distant states like Louisiana, Minnesota, and New York. This is, to a certain degree, expected given our sparse sampling of the United States but we are exploring with both phylogenetic analyses and further sampling why exactly this occurs.
Many transmission chains are evident in the state, which is characteristics of eastern states where the movement of the virus has very few geographic barriers and reintroductions are common. However, in contrast, Colorado samples also commonly cluster together within distinct clades, indicating some intermediate degree of geographic isolation more consistent with western states like California, Oregon, and Washington. In the majority of these clusters, we see that sequences group together based on both date and geographic location. There are exceptions but typically clustering sequences are from the same year and from the same city, though only two cities, Fort Collins and Loveland, were sampled. In the other clusters, we do see evidence of transmission chains persisting from one year to the next, or overwintering. There are multiple example of clusters containing sequences from 2013 through 2016. Interestingly, no sequences from 2017 or 2018 are found in overwintering transmission chains which might suggest a significant virus replacement event. However, an alternative explanation is that this is an artifact of our sampling scheme given that there are 81 sequences from 2013-2016 and only 13 sequences from 2017-2018. These two phenomena present Colorado as a unique situation were the virus that is seen every year in the result of both reintroduction from neighboring states, and persistence of the past year’s transmission chains.
Contamination Monitoring
This is the first batch of samples which we have processed with our new protocol for contamination monitoring. The approach involves spiking-in sample-specific barcoded transcripts at the beginning of library preparation to estimate the amount of spillover between samples. Table 1. contains a new Percent Contamination column which is the percentage of barcode reads that align to barcodes from other samples. In general, contamination is suitable low for all samples so as to not have interfered with downstream consensus calling and phylogenetic analysis. There are a few samples with higher contamination levels but we’re confident that these are a result of increased variability in the metric when the number of total barcode reads is low.
Disclaimer
Please note that this data is released as work in progress by the WestNile 4K Project and should be considered preliminary. If you intend to include any of these data in publications, please let us know – otherwise please feel free to download and use without restrictions. We have shared this data with the hope that people will download and use it, as well as scrutinize it so we can improve our methods and analyses. Please contact us if you have any questions or comments.