Collaboration and data sources
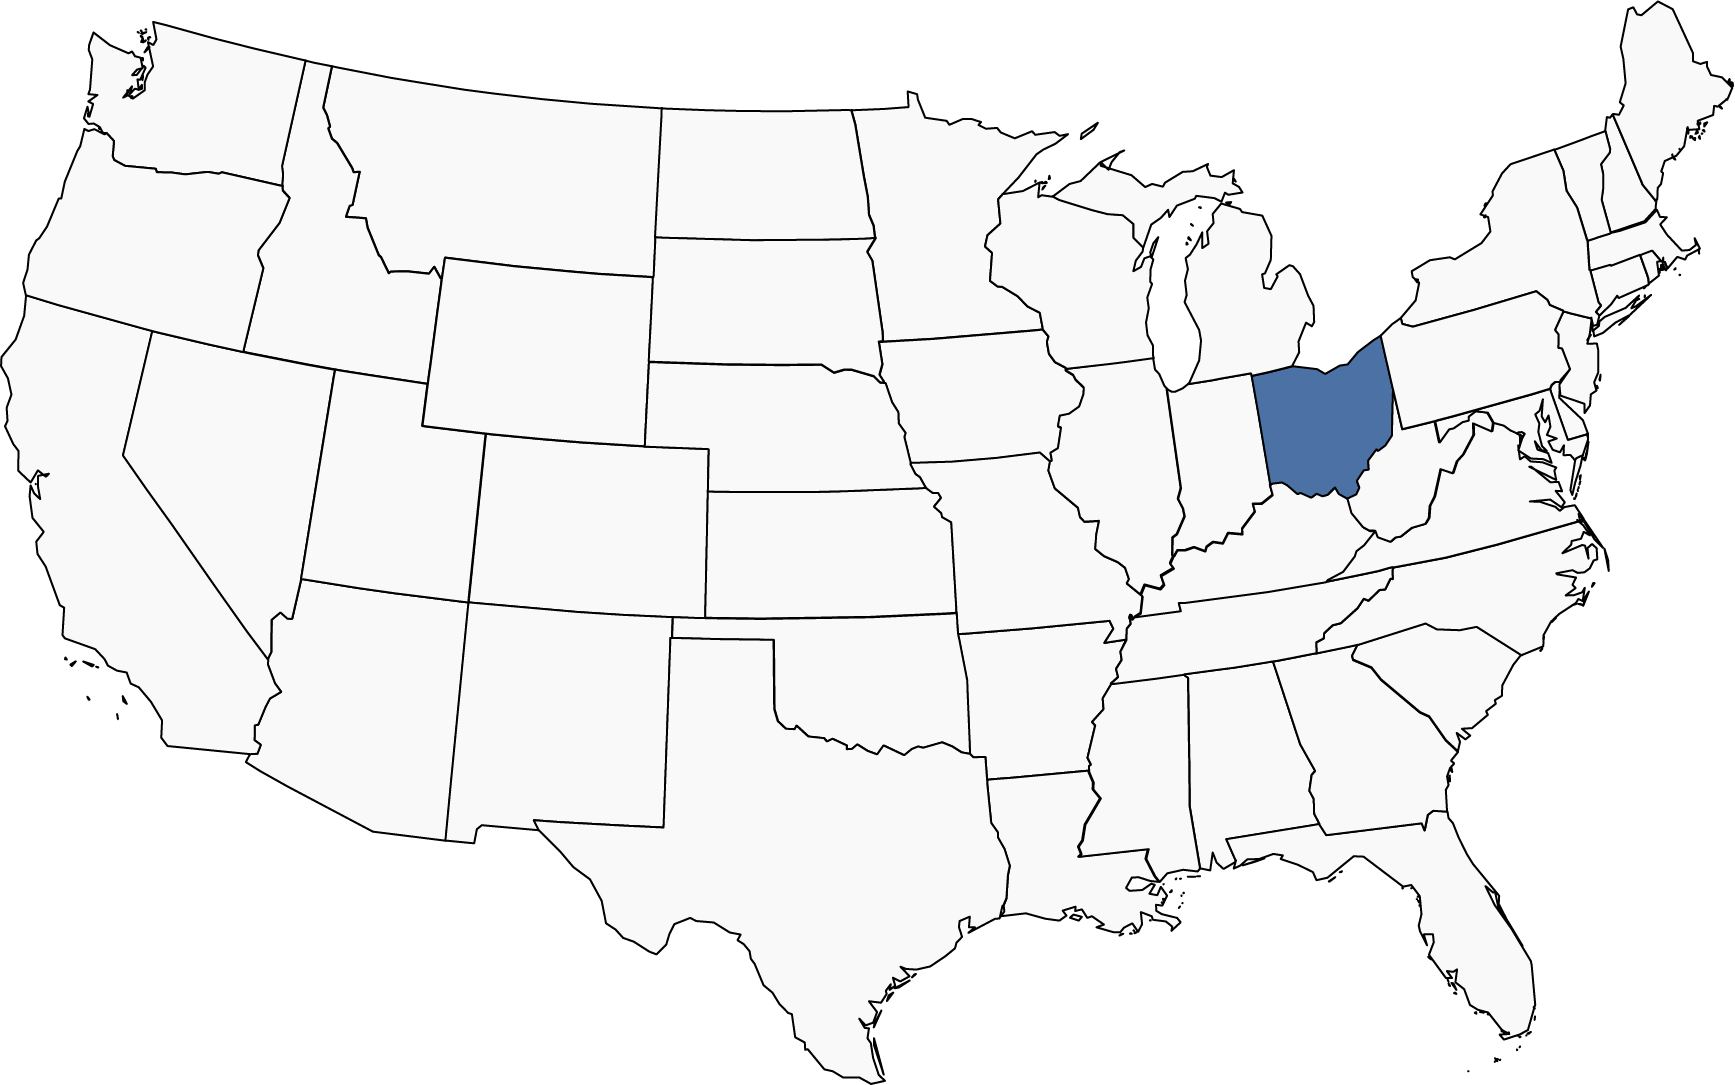
We received 200 samples of RNA extracted from mosquito pools that tested positive for West Nile virus from Leeanne Garrett, Kevin Sohner, and Jim Scott from the Ohio Department of Health. Samples were selected for sequencing from each of Ohio’s counties that we had samples from based on the counties’ reported West Nile virus incidence rate for a particular year. 27 samples were ultimately selected and had suitable genome coverage after sequencing for phylogenetic analysis. The samples came from 8 counties and a single year, 2018. In this update, we highlight the sequencing results and a few conclusions drawn from a maximum likelihood based phylogenetic analysis.
Data Generation
The sequencing data was generated using an amplicon-based sequencing scheme, PrimalSeq (Grubaguh et al. Genome Biology 2019). Our full protocol is available online here. Sequencing reads were aligned using bwa and processed using iVar.
Raw data
Consensus sequences and BAM files along with associated metadata are available on Google Cloud. Alignment statistics are shown in Table 1 below.
| Table 1. Alignment statistics | ||
|---|---|---|
| Sample | Percent Genome Coverage | Mean Coverage per Nucleotide |
| W0831 | 98.9% | 2319.1 |
| W0832 | 74.6% | 1114.2 |
| W0835 | 100.0% | 965.0 |
| W0836 | 100.0% | 1804.0 |
| W0839 | 81.9% | 1409.3 |
| W0840 | 70.3% | 1373.4 |
| W0842 | 97.8% | 1947.7 |
| W0845 | 91.0% | 1614.0 |
| W0848 | 69.6% | 1106.3 |
| W0856 | 97.9% | 1278.2 |
| W0858 | 97.7% | 1784.8 |
| W0860 | 100.0% | 1262.8 |
| W0861 | 98.1% | 1754.2 |
| W0865 | 100.0% | 1761.0 |
| W0870 | 100.0% | 1279.2 |
| W0875 | 82.5% | 1923.0 |
| W0881 | 69.8% | 1306.6 |
| W0885 | 97.8% | 1566.2 |
| W0891 | 100.0% | 1737.4 |
| W0897 | 99.6% | 1586.9 |
| W0899 | 100.0% | 1851.7 |
| W0901 | 97.4% | 5515.2 |
| W0902 | 98.1% | 1350.1 |
| W0909 | 80.1% | 1509.2 |
| W1503 | 90.2% | 1644.4 |
| W1505 | 100.0% | 1305.9 |
| W1507 | 100.0% | 1293.1 |
Preliminary Analysis
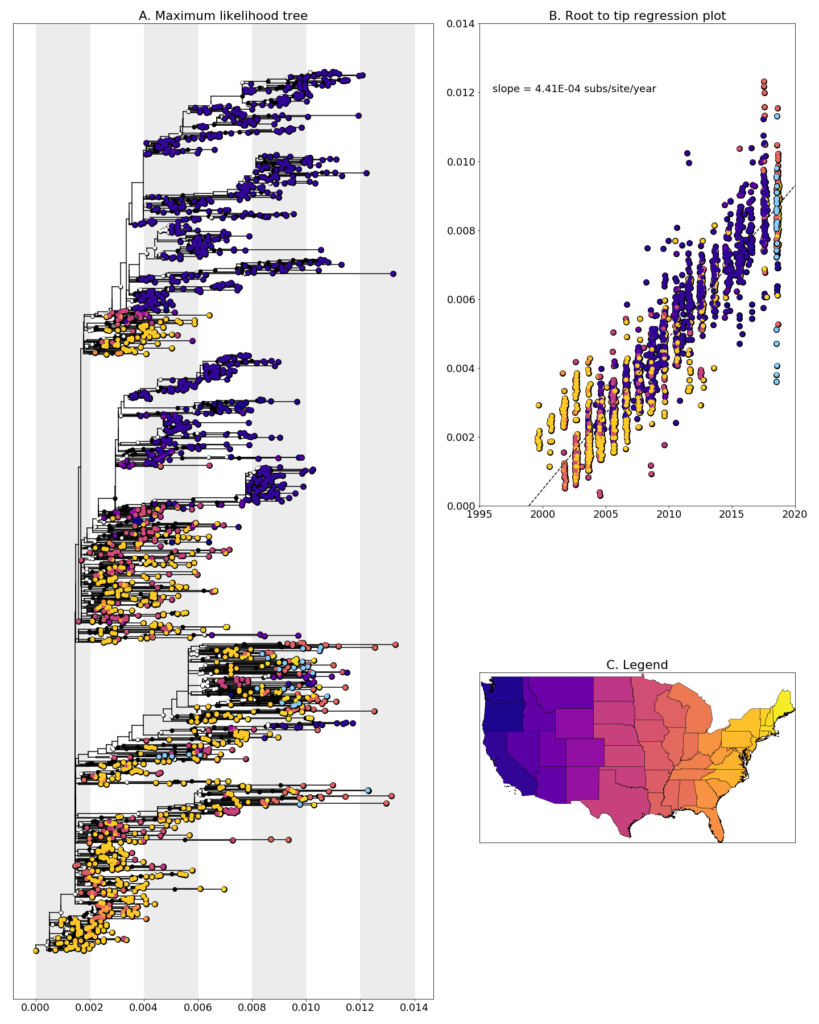
We constructed a maximum likelihood (ML) phylogeny using 1927 genomes of West Nile virus from USA including 27 of the provided samples which had genome coverage greater than 70%, highlighted in light blue. Tree and root to tip regression plot are shown in Figure 1.

Figure 1: A. Maximum Likelihood tree constructed using RAxML (Bootstrap repeated 100 times) with 1927 genomes of West Nile virus from USA including 26 genomes provided by the Ohio Department of Health (highlighted in light blue). B. Root to tip regression plot. C. Legend
Ohio sequences are found entirely within branches with are made up of sequences from the Eastern United States. In general, the sequences don’t cluster together and the most closely related sequences are those from New York, New Hampshire, and Louisiana. This could be evidence of a high number of introductions of WNV into Ohio, though when and how often these introductions occurred is difficult to say without more sampling from previous years and neighboring states. An alternative explanation for these large leaps in virus transmission could be contamination, given that the closely related sequences come from samples we processed in the same laboratory. We are currently exploring both possibilities and will report on our findings when we have something conclusive.
Additionally, none of the newly generated sequences are clustered with the previously generated Ohio sequences from 2001-2002 when the virus was spreading across the United States. This aligns well with reports of the NY99 strain, which these earlier samples were, being completely replaced by more recently evolved strains WN02, and SW03. Sequences which do cluster together mainly come from geographically close locations collected at similar times, such as W1503 and W0897 which are both from Montgomery County, or W0861, W0856, and W0842 which are all from Franklin County.
Disclaimer
Please note that this data is released as work in progress by the WestNile 4K Project and should be considered preliminary. If you intend to include any of these data in publications, please let us know – otherwise please feel free to download and use without restrictions. We have shared this data with the hope that people will download and use it, as well as scrutinize it so we can improve our methods and analyses. Please contact us if you have any questions or comments.


