

Collaboration and Data Sources
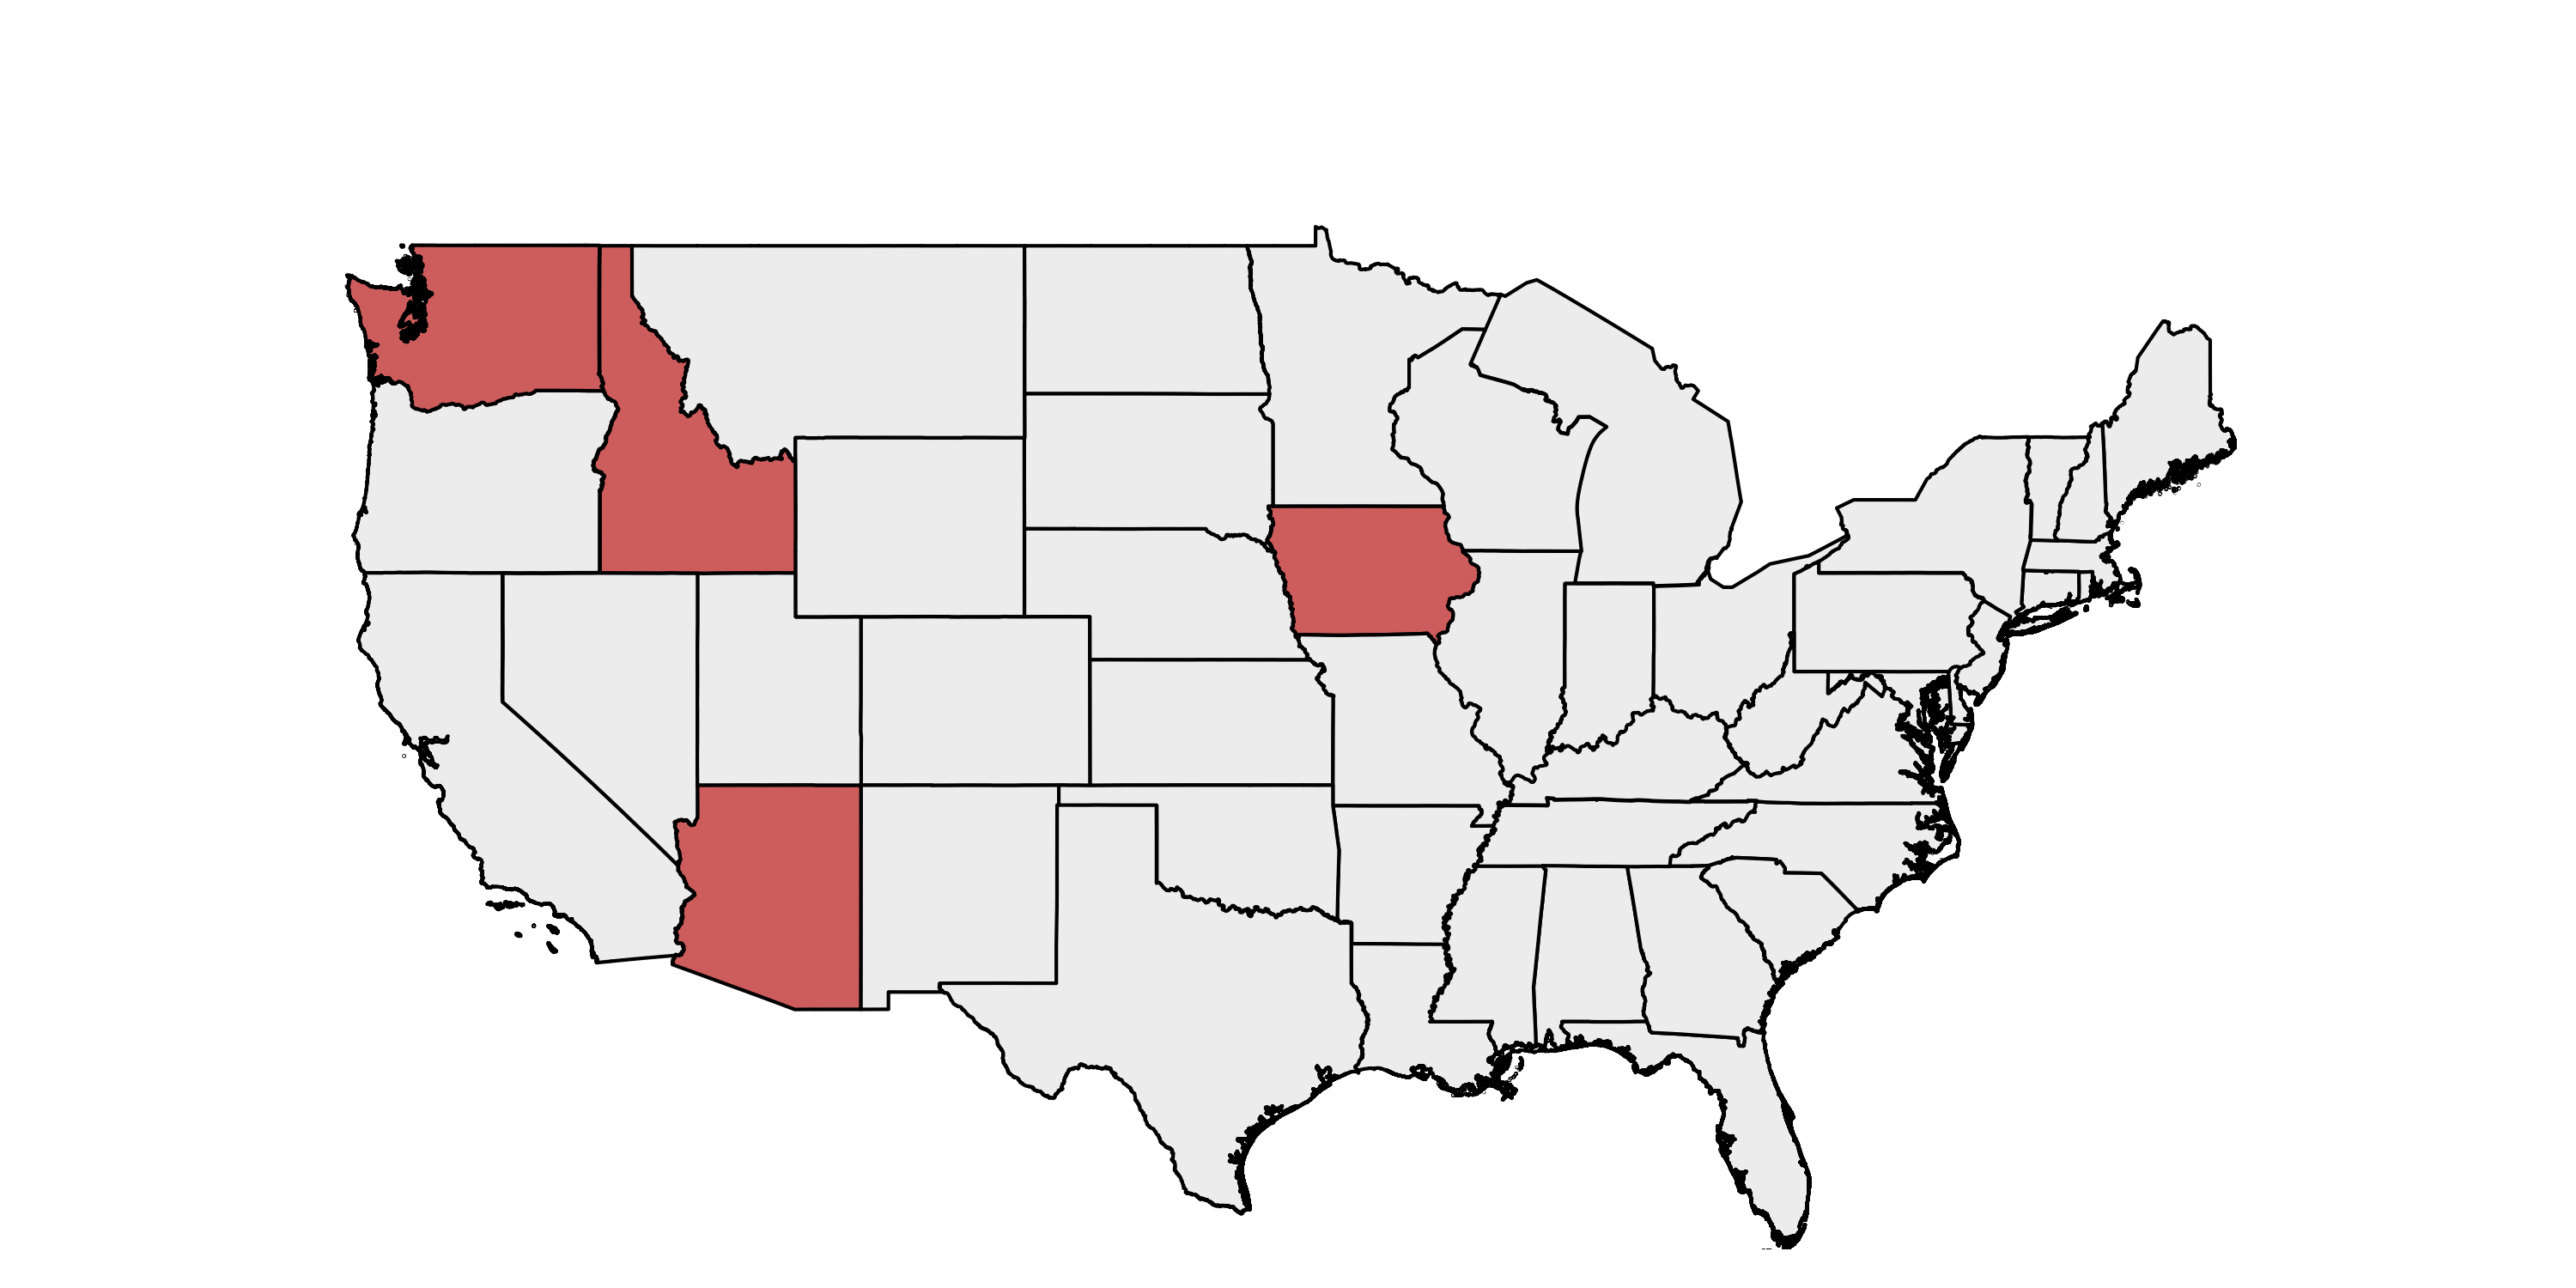
We received 15 samples of RNA extracted from birds that tested positive for West Nile virus from Dan Bradway, Becca Wolking, and Marla Francis from the Washington Animal Disease Diagnostic Laboratory (WADDL). The samples were spread across five years: 1 from 2013, 1 from 2014, 5 from 2015, 2 from 2016, and the remaining 6 from 2017. The samples were also spread across states: 2 from Arizona, 2 from Idaho, 1 from Iowa, 1 from the US Virgin Islands and 9 from Washington.
Data Generation
The sequencing data was generated using PrimalSeq (Grubaugh et al. Genome Biology 2019). Our full protocol is available online here. Sequence reads were aligned using bwa and processed using iVar.
Raw Data
Consensus sequences and BAM files along with associated metadata are available on Google Cloud. Alignment statistics are shown in Table 1.
| Table 1. Alignment statistics | ||
| Name | Percent coverage at a minimum depth of 10 | Average depth per nucleotide |
|---|---|---|
| W0918.bam | 100.0% | 4546.9 |
| W0919.bam | 16.5% | 192.6 |
| W0920.bam | 100.0% | 4210.4 |
| W0921.bam | 100.0% | 4942.9 |
| W0922.bam | 74.7% | 2825.0 |
| W0923.bam | 50.8% | 1706.7 |
| W0924.bam | 73.3% | 2730.2 |
| W0925.bam | 97.5% | 4034.5 |
| W0926.bam | 100.0% | 3826.0 |
| W0927.bam | 91.8% | 3890.2 |
| W0928.bam | 63.7% | 1857.3 |
| W0929.bam | 100.0% | 2616.8 |
| W0930.bam | 82.3% | 3460.9 |
| W0931.bam | 74.0% | 2757.6 |
| W0932.bam | 27.0% | 381.1 |
Preliminary Analysis
We constructed a maximum likelihood (ML) phylogeny using 1829 genomes of West Nile virus from USA including 11 of the provided samples which had genome coverage greater than 75%, highlighted in light blue. Tree and root to tip regression plot are shown in Figure 1.
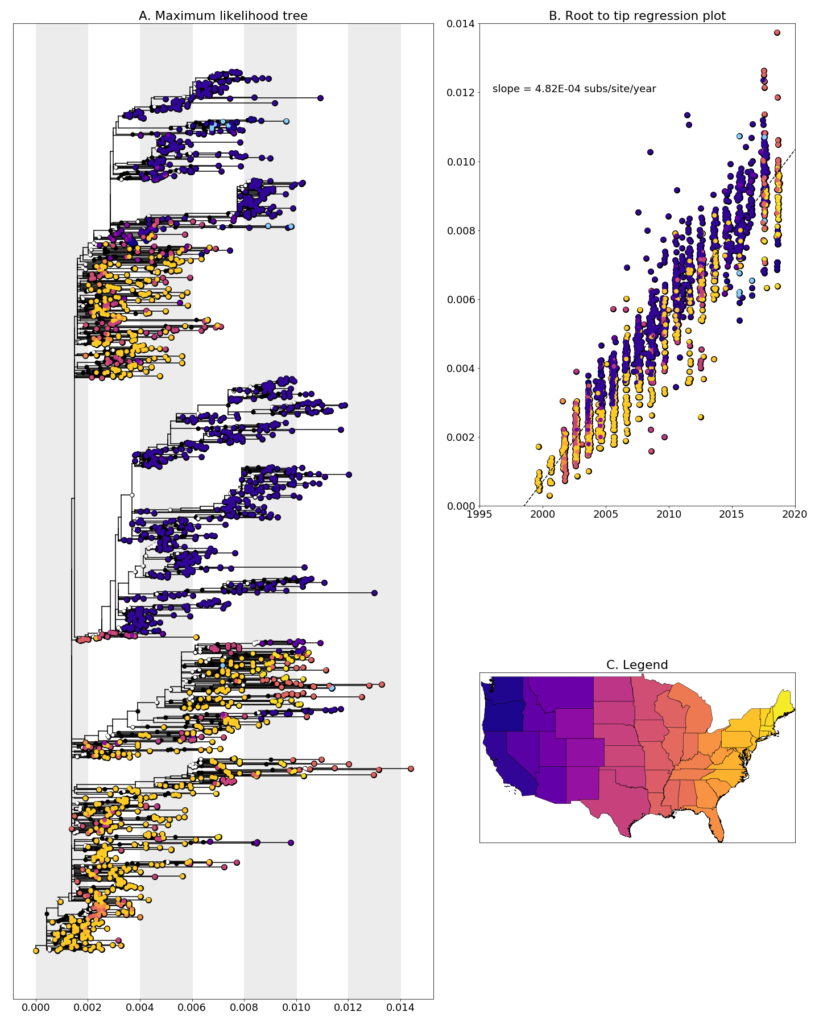
Figure 1: A. Maximum Likelihood tree constructed using RAxML (bootstrap repeated 100 times) with 1829 genomes of West Nile virus from USA including 11 genomes provided by WADDL (highlighted in light blue). B. Root to tip regression plot. C. Legend.
All but a single sample from Washington clustered together and with other Washington and Oregon sequences from other sources with high support values. Sequences within this cluster are from multiple years which provide support that the lineage is overwintering in the state rather than being reintroduced each year. The singleton sequence from the US Virgin Islands (W0918) clustered with a sample from New York from the following year. However, because we only have a single sequence from the Virgin Islands, it would be difficult to make any conclusions from its placement in the tree. W0927 and W0929 from Idaho cluster together with Oregon sequences from three years earlier. Together they fall in a lineage that includes earlier samples from California and Arizona which suggests south to north movement of the virus.
Disclaimer
Please note that this data is released as work in progress by the WestNile 4K Project and should be considered preliminary. If you intend to include any of these data in publications, please let us know – otherwise please feel free to download and use without restrictions. We have shared this data with the hope that people will download and use it, as well as scrutinize it so we can improve our methods and analyses. Please contact us if you have any questions or comments.