

Collaboration and Data Sources
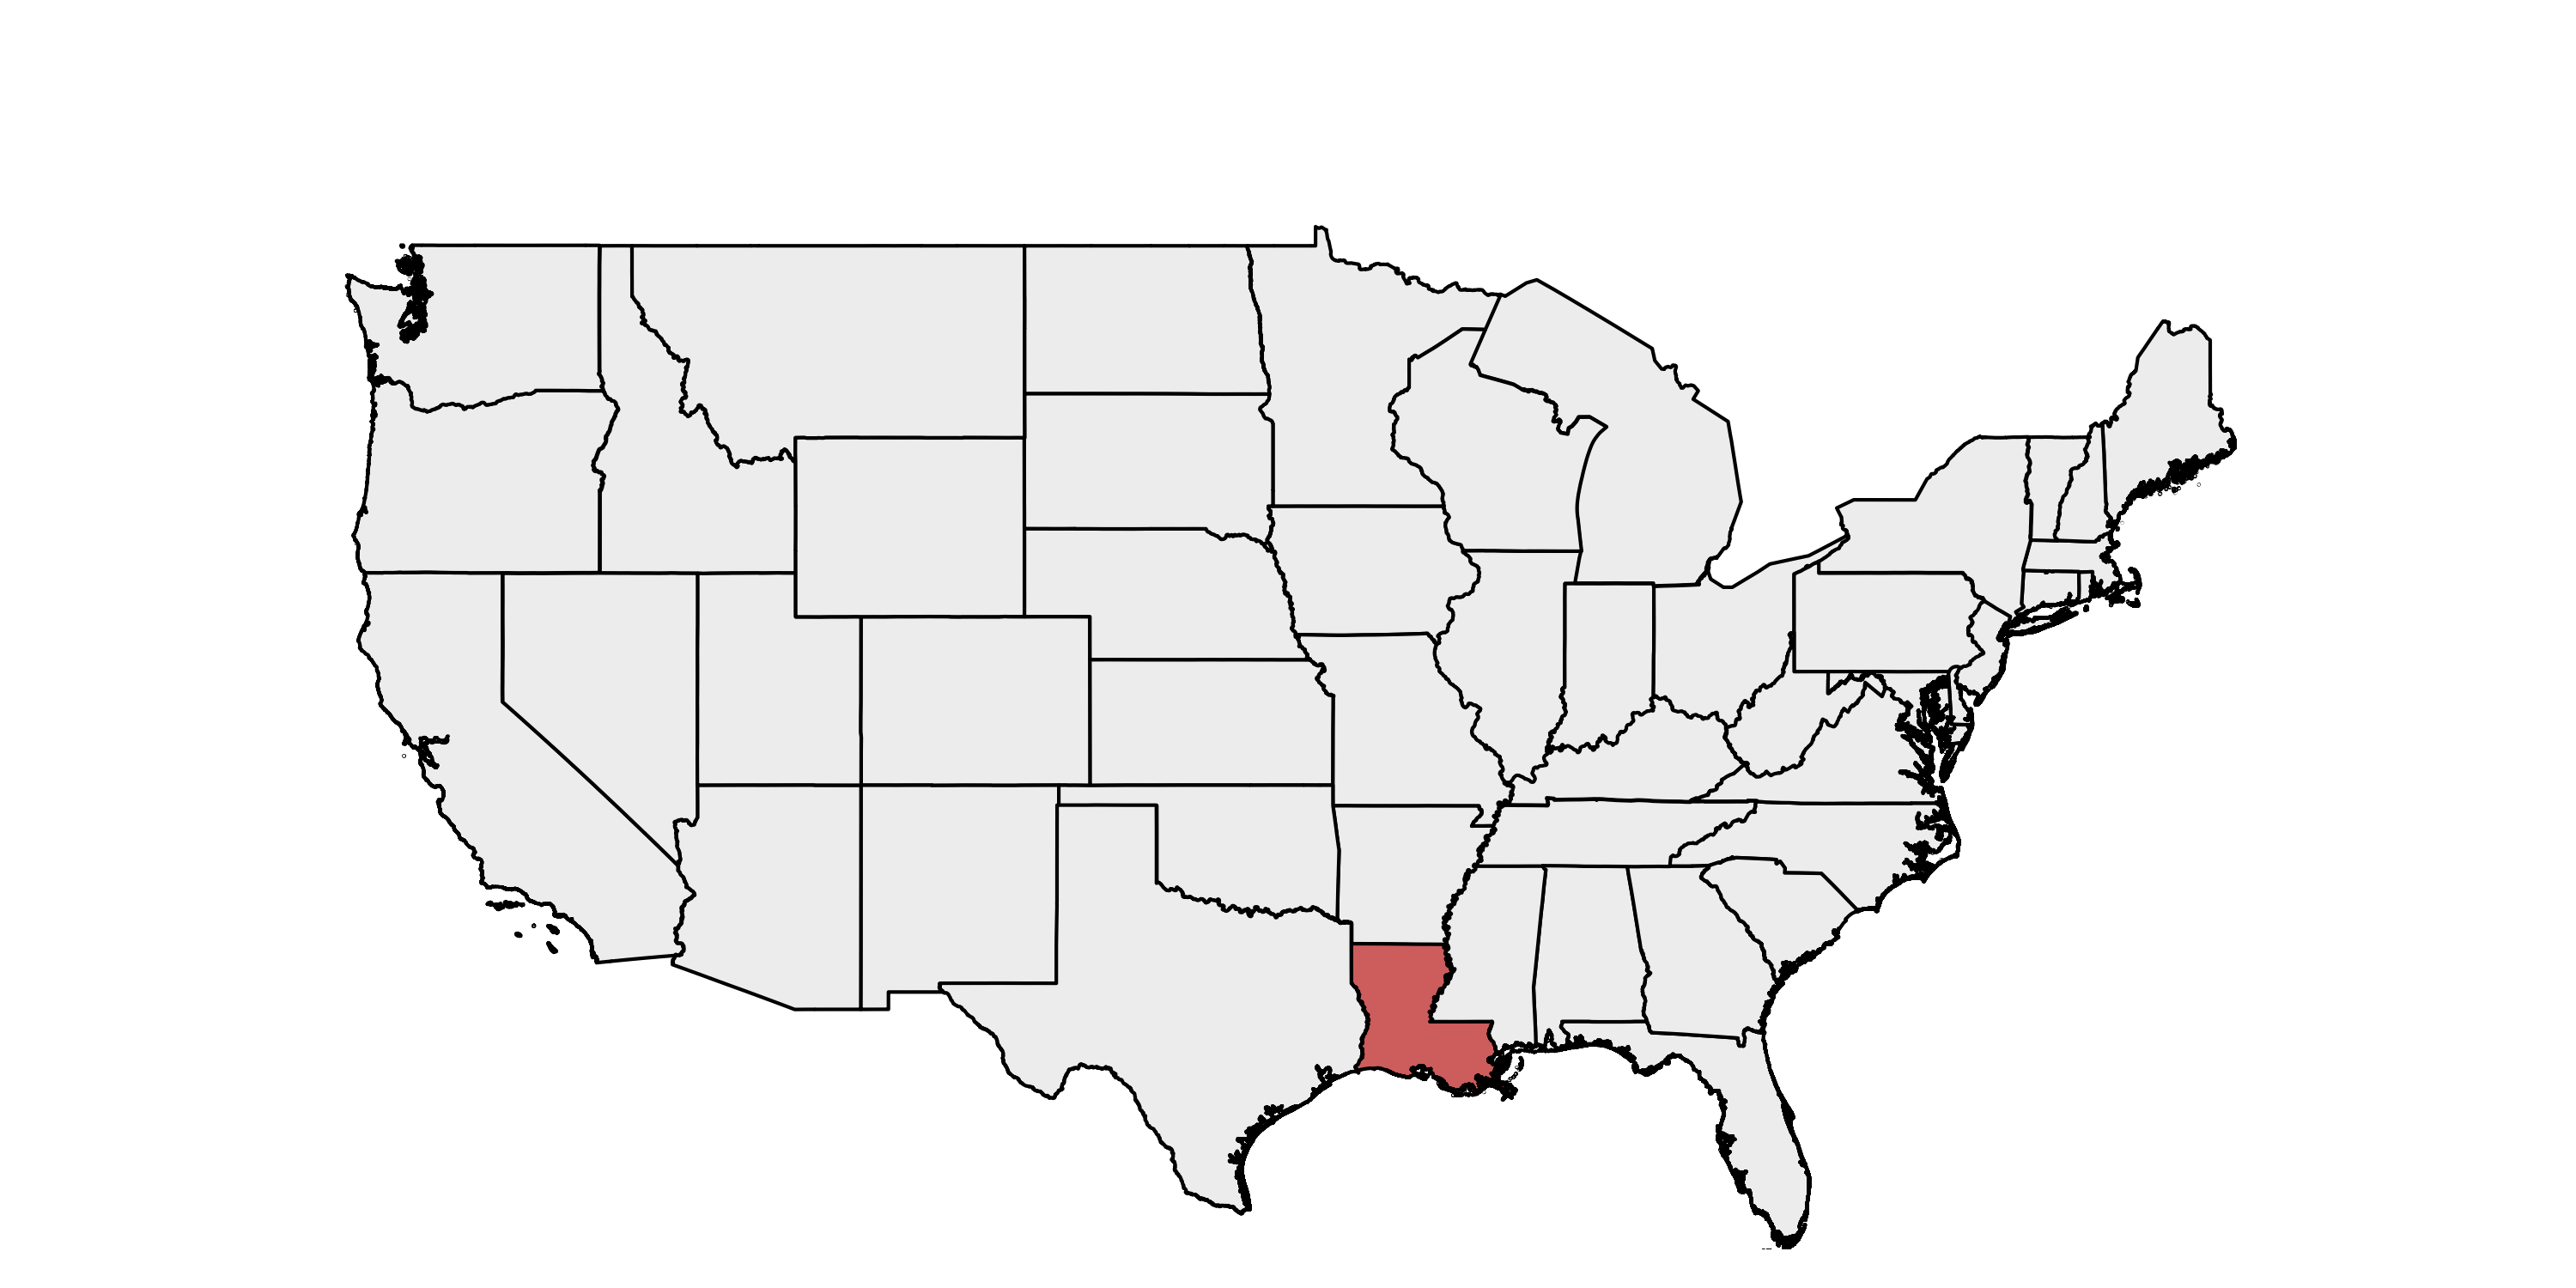
We received 532 samples of RNA extracted from mosquito pools that tested positive for West Nile virus from Udeni Balasuriya, Zelalem Mekuria, Rebecca Christofferson, Tarra Harden, Laura Peak, Alma Roy, and Keith Strother, from the Louisiana Animal Disease Diagnostic Laboratory (LADDL) at Louisiana State University. Samples were selected for sequencing from each of Louisiana’s parishes based on the parishes’ reported West Nile virus incidence rate for a particular year. 73 samples were ultimately selected, of which 46 samples had suitable genome coverage after two rounds of sequencing for phylogenetic analysis. The samples were spread across two years: 28 from 2017 and 20 from 2018.
Data Generation
The sequencing data was generated using PrimalSeq (Grubaugh et al. Genome Biology 2019). Our full protocol is available online here. Sequence reads were aligned using bwa and processed using iVar.
Raw Data
Consensus sequences and BAM files along with associated metadata are available on Google Cloud. Alignment statistics are shown in Table 1.
| Table 1. Alignment statistics | ||
| Name | Percent coverage at a minimum depth of 10 | Average depth per nucleotide |
|---|---|---|
| W1298.bam | 94.5% | 2311.5 |
| W1299.bam | 79.8% | 2349.3 |
| W1300.bam | 91.5% | 4217.0 |
| W1301.bam | 96.8% | 4713.5 |
| W1302.bam | 98.3% | 6091.6 |
| W1303.bam | 94.7% | 3621.8 |
| W1305.bam | 100.0% | 2961.9 |
| W1306.bam | 98.7% | 3923.9 |
| W1307.bam | 99.6% | 1881.3 |
| W1308.bam | 96.8% | 4210.9 |
| W1309.bam | 96.6% | 4381.9 |
| W1322.bam | 97.5% | 3309.2 |
| W1323.bam | 77.8% | 3373.6 |
| W1324.bam | 98.9% | 4864.2 |
| W1326.bam | 100.0% | 4912.4 |
| W1327.bam | 100.0% | 4526.2 |
| W1328.bam | 94.9% | 3270.0 |
| W1329.bam | 100.0% | 4787.3 |
| W1330.bam | 100.0% | 4950.1 |
| W1331.bam | 96.9% | 3369.0 |
| W1332.bam | 98.7% | 4983.4 |
| W1334.bam | 98.7% | 4985.4 |
| W1335.bam | 98.8% | 3325.0 |
| W1336.bam | 99.4% | 4093.8 |
| W1337.bam | 100.0% | 5064.7 |
| W1338.bam | 98.7% | 4015.7 |
| W1339.bam | 99.2% | 4540.0 |
| W1342.bam | 98.8% | 4011.1 |
| W1344.bam | 100.0% | 3720.1 |
| W1345.bam | 84.1% | 2013.1 |
| W1346.bam | 96.0% | 3757.5 |
| W1353.bam | 100.0% | 4193.5 |
| W1354.bam | 93.3% | 2341.1 |
| W1356.bam | 97.9% | 4366.3 |
| W1362.bam | 78.3% | 2656.8 |
| W1364.bam | 97.9% | 3932.9 |
| W1367.bam | 85.2% | 1627.3 |
| W1368.bam | 78.6% | 1034.7 |
| W1369.bam | 99.6% | 3047.3 |
| W1370.bam | 70.7% | 3062.0 |
| W1372.bam | 84.4% | 2652.0 |
| W1373.bam | 84.7% | 2293.4 |
| W1374.bam | 98.0% | 3230.6 |
| W1375.bam | 100.0% | 4227.7 |
| W1378.bam | 100.0% | 2511.7 |
| W1379.bam | 95.6% | 2071.1 |
Preliminary Analysis
We constructed a maximum likelihood (ML) phylogeny using 1829 genomes of West Nile virus from USA including 46 of the provided samples which had genome coverage greater than 70%, highlighted in light blue. Tree and root to tip regression plot are shown in Figure 1.
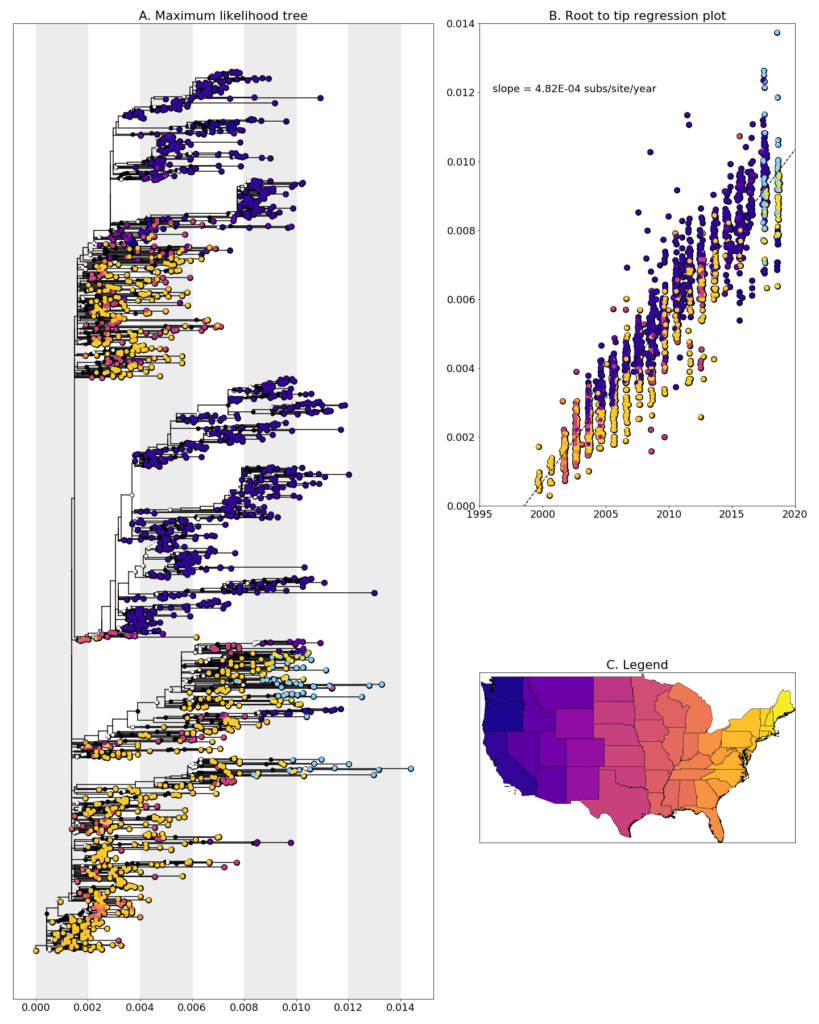
Figure 1: A. Maximum Likelihood tree constructed using RAxML (Bootstrap repeated 100 times) with 1829 genomes of West Nile virus from USA including 48 genomes provided by LADDL (highlighted in light blue). B. Root to tip regression plot. C. Legend
Louisiana samples are found spread throughout the tree and mostly cluster with sequences from New York and New Hampshire. These sequences form multiple separate clades which indicates that there have been multiple introductions into Louisiana over the years. Closely related New York and New Hampshire sequences are from years both preceding and following the collection dates of the Louisiana samples which suggests that the introductions are from neighboring states, however, more sampling is required to say anything conclusively. The only years represented by these samples are 2017 and 2018, it is difficult to determine the direction of movement. Samples clustered together are from the same year in all but two cases. W1303, collected in 2017, and W1326, collected in 2018, cluster together and with a sample from New York with a bootstrap support value of 98. W1345, collected in 2018, forms a clade with ten other Louisiana samples from 2017, thought a bootstrap support value of 30 indicates a significant amount of uncertainty in its placement. Additional sampling from earlier years would allow us to determine if the virus is able to overwinter in Louisiana.
Disclaimer
Please note that this data is released as work in progress by the WestNile 4K Project and should be considered preliminary. If you intend to include any of these data in publications, please let us know – otherwise please feel free to download and use without restrictions. We have shared this data with the hope that people will download and use it, as well as scrutinize it so we can improve our methods and analyses. Please contact us if you have any questions or comments.