

Collaboration and Data Sources
We received 41 samples of RNA extracted from mosquito pools that tested positive for West Nile virus from Denise Bolton, Abigail Mathewson, Carolyn Fredett, Amy Kutschke and Rebecca Lovell at the New Hampshire Division of Public Health Services, Department of Health and Human Services. The samples were spread across four years: 2 from 2013, 2 from 2015, 9 from 2017 and the remaining from 2018. We were able to sequence the complete coding region of the viral genome from all 41 samples. In this update, we highlight the sequencing results and a few conclusions drawn from a maximum likelihood based phylogenetic analysis.
Data Generation
The sequencing data was generated using PrimalSeq (Grubaugh et al. Genome Biology 2019). Our full protocol is available online here. Sequenced reads were aligned using bwa and processed using iVar.
Raw Data
Consensus sequences and BAM files along with associated metadata are available on Google Cloud. Alignment statistics are shown in Table 1.
| Table 1. Alignment statistics | ||
| Name | Percent coverage at a minimum depth of 10 | Average depth per nucleotide |
| W830_L1.sorted.bam | 99.5194 | 2897.05 |
| W826_L1_L2.sorted.bam | 89.7452 | 1824.97 |
| W828_L1_L2.sorted.bam | 95.9833 | 5204.15 |
| W827_L1_L2.sorted.bam | 96.2463 | 5749.02 |
| W825_L1.sorted.bam | 99.2746 | 5615.95 |
| W829_L1_L2.sorted.bam | 93.9704 | 5031.84 |
| W824_L1.sorted.bam | 99.2746 | 6060.01 |
| W0960_L1.sorted.bam | 99.3834 | 2703.57 |
| W0953_L1.sorted.bam | 99.3834 | 3807.76 |
| W0959_L1.sorted.bam | 99.3834 | 4837.44 |
| W0952_L1.sorted.bam | 99.3834 | 5426.26 |
| W0962_L1.sorted.bam | 98.9301 | 4903.42 |
| W0964_L1.sorted.bam | 99.3834 | 5783.27 |
| W0955_L1.sorted.bam | 98.6853 | 5536.62 |
| W0954_L1.sorted.bam | 99.3472 | 5104 |
| W0951_L1.sorted.bam | 99.3834 | 5530.52 |
| W0961_L1.sorted.bam | 98.6853 | 5681.15 |
| W0956_L1.sorted.bam | 89.6727 | 3738.55 |
| W0950_L1.sorted.bam | 98.8757 | 5124.33 |
| W0957_L1.sorted.bam | 99.3834 | 5695.19 |
| W0958_L1.sorted.bam | 99.3834 | 5555.3 |
| W0965_L1.sorted.bam | 98.6853 | 6179.75 |
| W0963_L1.sorted.bam | 99.3834 | 5948.02 |
| W0966_L1.sorted.bam | 99.0389 | 5921.09 |
| W0967_L1.sorted.bam | 98.6944 | 4447.62 |
| W0968_L1.sorted.bam | 99.0389 | 5918.12 |
| W0969_L1.sorted.bam | 99.057 | 5746.22 |
| W0972_L1.sorted.bam | 97.8783 | 5214.78 |
| W0975_L1.sorted.bam | 99.3834 | 5505.91 |
| W0970_L1.sorted.bam | 99.3834 | 5336.29 |
| W0971_L1.sorted.bam | 99.3834 | 5630.81 |
| W0976_L1.sorted.bam | 98.6853 | 5860.87 |
| W0977_L1.sorted.bam | 99.3834 | 5125.68 |
| W0973_L1.sorted.bam | 98.6853 | 5268.41 |
| W0974_L1.sorted.bam | 97.8783 | 4972.23 |
| W0979_L1.sorted.bam | 96.1193 | 4546.19 |
| W0981_L1.sorted.bam | 97.9509 | 5041.67 |
| W0978_L1.sorted.bam | 99.3834 | 5676.35 |
| W0980_L1.sorted.bam | 96.2463 | 5162.74 |
| W0983_L1.sorted.bam | 99.3834 | 5261.99 |
| W0982_L1.sorted.bam | 99.3834 | 5296.17 |
| W0984_L1.sorted.bam | 99.3925 | 5837.21 |
| W0985_L1.sorted.bam | 98.2319 | 5078.8 |
| W0986_L1.sorted.bam | 99.3925 | 5394.15 |
| W0990_L1.sorted.bam | 99.3834 | 4552.8 |
| W0988_L1.sorted.bam | 99.3834 | 5870.9 |
| W0987_L1.sorted.bam | 99.3834 | 5547.53 |
| W0989_L1.sorted.bam | 98.6944 | 5572.72 |
Preliminary Analysis
We constructed a maximum likelihood(ML) phylogeny using 1753 genomes of West Nile virus from USA including 41 genomes from New Hampshire (highlighted in forest green). Tree, root to tip regression plot are shown in Fig 1.
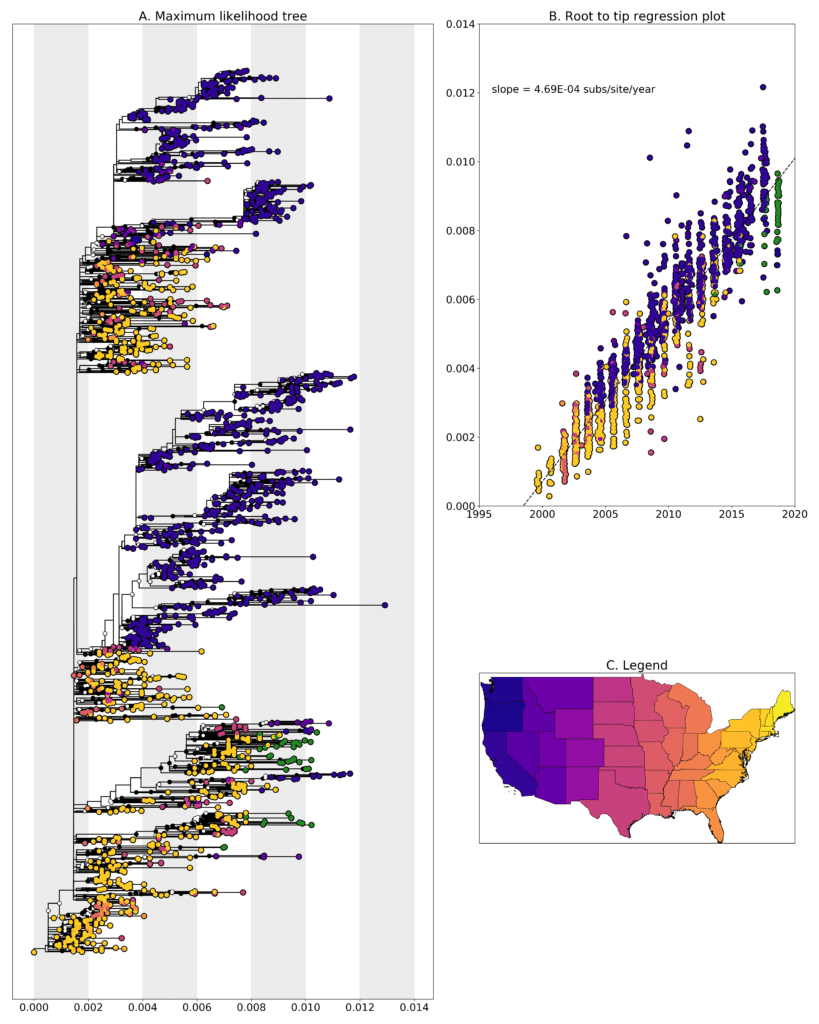
Figure 1: A. Maximum likelihood tree constructed using RAxML (Bootstrap repeated 100 times) with 1753 genomes of West Nile virus from USA including 41 genomes from New Hampshire (highlighted in forest green). B. Root to tip regression plot. C. Legend
Most of the sequences cluster with sequences from New York state but they form separate clades indicating that there have been multiple introductions into New Hampshire over the years. Given the current sampling, it’s hard to pin point if those introductions might have come from New York. W0971 from 2018-08-16 clusters along with sequences from San Diego county in California sampled in 2015 with a bootstrap support value is 77. W0953 clusters with sequences from Texas sampled in 2012 but has a very low bootstrap support value of 20. Further analysis required to see where this sequence might end up in the tree. Sequences W0967, W0968 and W0969 were identical. All three were sampled from Hillsborough county either on 2018-08-13 or 2018-08-14.
Disclaimer
Please note that this data is released as work in progress by the WestNile 4K Project and should be considered preliminary. If you intend to include any of these data in publications, please let us know – otherwise please feel free to download and use without restrictions. We have shared this data with the hope that people will download and use it, as well as scrutinize it so we can improve our methods and analyses. Please contact us if you have any questions or comments.