

Collaboration and Data Sources
We received 17 samples of RNA extracted from 15 mosquito pools and 2 birds that tested positive for West Nile virus from Donna Mulrooney, Manoj Pastey, Justin Sanders, Andree Hunkapiller, Noah Lawler, Sarah Greene, from the Oregon Veterinary Diagnostic Laboratory. The samples were spread across seven years: 1 from 2010, 2 from 2011, 2 from 2014, 2 from 2015, 4 from 2016, 3 from 2017, and the remaining 3 from 2018. The samples were also spread across two states: 11 from Oregon and 6 from Washington
Data Generation
The sequencing data was generated using PrimalSeq (Grubaugh et al. Genome Biology 2019). Our full protocol is available online here. Sequence reads were aligned using bwa and processed using iVar.
Raw Data
Consensus sequences and BAM files along with associated metadata are available on Google Cloud. Alignment statistics are shown in Table 1.
| Table 1. Alignment statistics | ||
| Name | Percent coverage at a minimum depth of 10 | Average depth per nucleotide |
|---|---|---|
| W0933.bam | 100.0% | 3829.1 |
| W0934.bam | 52.5% | 1365.0 |
| W0935.bam | 32.6% | 9.6 |
| W0936.bam | 71.0% | 871.3 |
| W0937.bam | 93.7% | 3052.0 |
| W0938.bam | 82.6% | 3221.6 |
| W0939.bam | 97.7% | 3640.0 |
| W0940.bam | 100.0% | 3797.3 |
| W0941.bam | 100.0% | 4442.3 |
| W0942.bam | 100.0% | 4120.4 |
| W0943.bam | 100.0% | 3747.9 |
| W0944.bam | 100.0% | 3836.8 |
| W0945.bam | 100.0% | 2912.7 |
| W0946.bam | 100.0% | 3277.2 |
| W0947.bam | 98.46% | 4278.8 |
| W0948.bam | 100.0% | 3908.5 |
| W0949.bam | 99.43% | 4048.3 |
Preliminary Analysis
We constructed a maximum likelihood (ML) phylogeny using 1829 genomes of West Nile virus from USA including 15 of the provided samples which had genome coverage greater than 70%, highlighted in light blue. Tree and root to tip regression plot are shown in Figure 1.
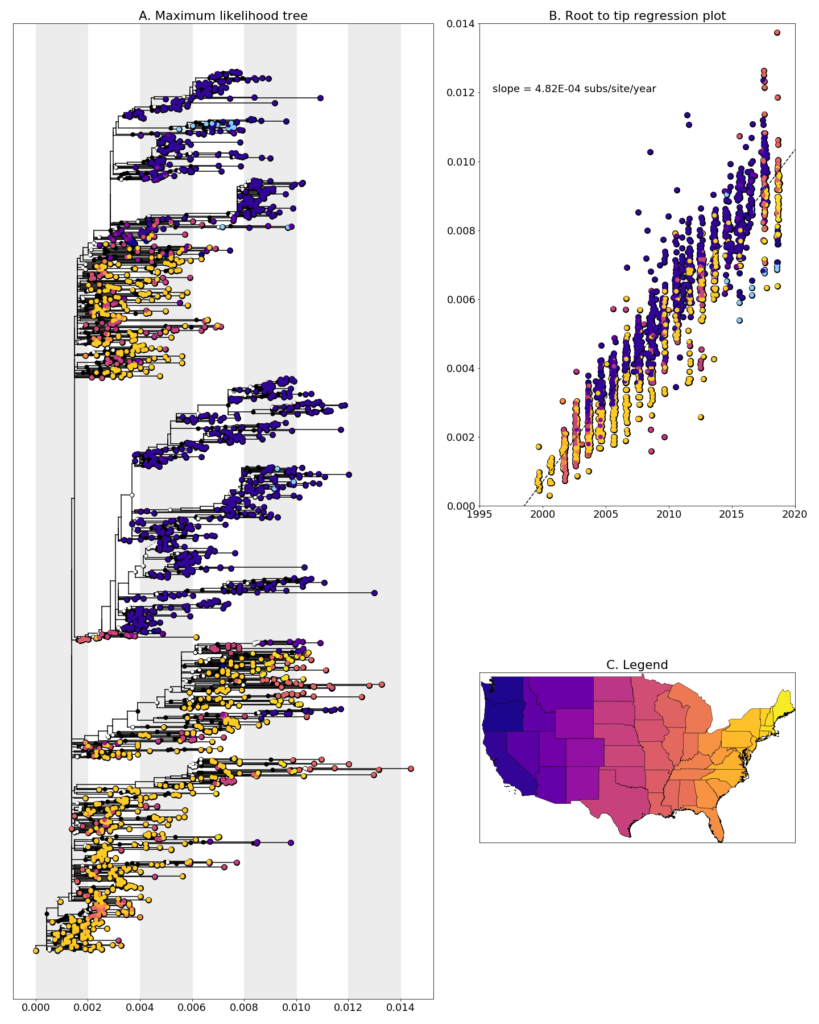
Figure 1: A. Maximum Likelihood tree constructed using RAxML (Bootstrap repeated 100 times) with 1829 genomes of West Nile virus from USA including 15 genomes provided by Oregon Veterinary Diagnostic Laboratory (highlighted in light blue). B. Root to tip regression plot. C. Legend
In general, sequences clade together suggesting south to north movement of the virus. Oregon samples, W0936 and W09367 cluster closely, with a bootstrap support value of 59, with Idaho sequences from a following year and with a sequences from San Diego and Arizona from preceding years. The remaining samples cluster in a well supported clade with Oregon and Washington sequences from other sources with collection dates ranging from 2010-2018. This provides evidence that lineage is overwintering in Washington, as opposed to being reintroduced from elsewhere every year. More sampling, especially in neighboring states, is needed to confirm if this a common occurrence or a rare event.
Disclaimer
Please note that this data is released as work in progress by the WestNile 4K Project and should be considered preliminary. If you intend to include any of these data in publications, please let us know – otherwise please feel free to download and use without restrictions. We have shared this data with the hope that people will download and use it, as well as scrutinize it so we can improve our methods and analyses. Please contact us if you have any questions or comments.